
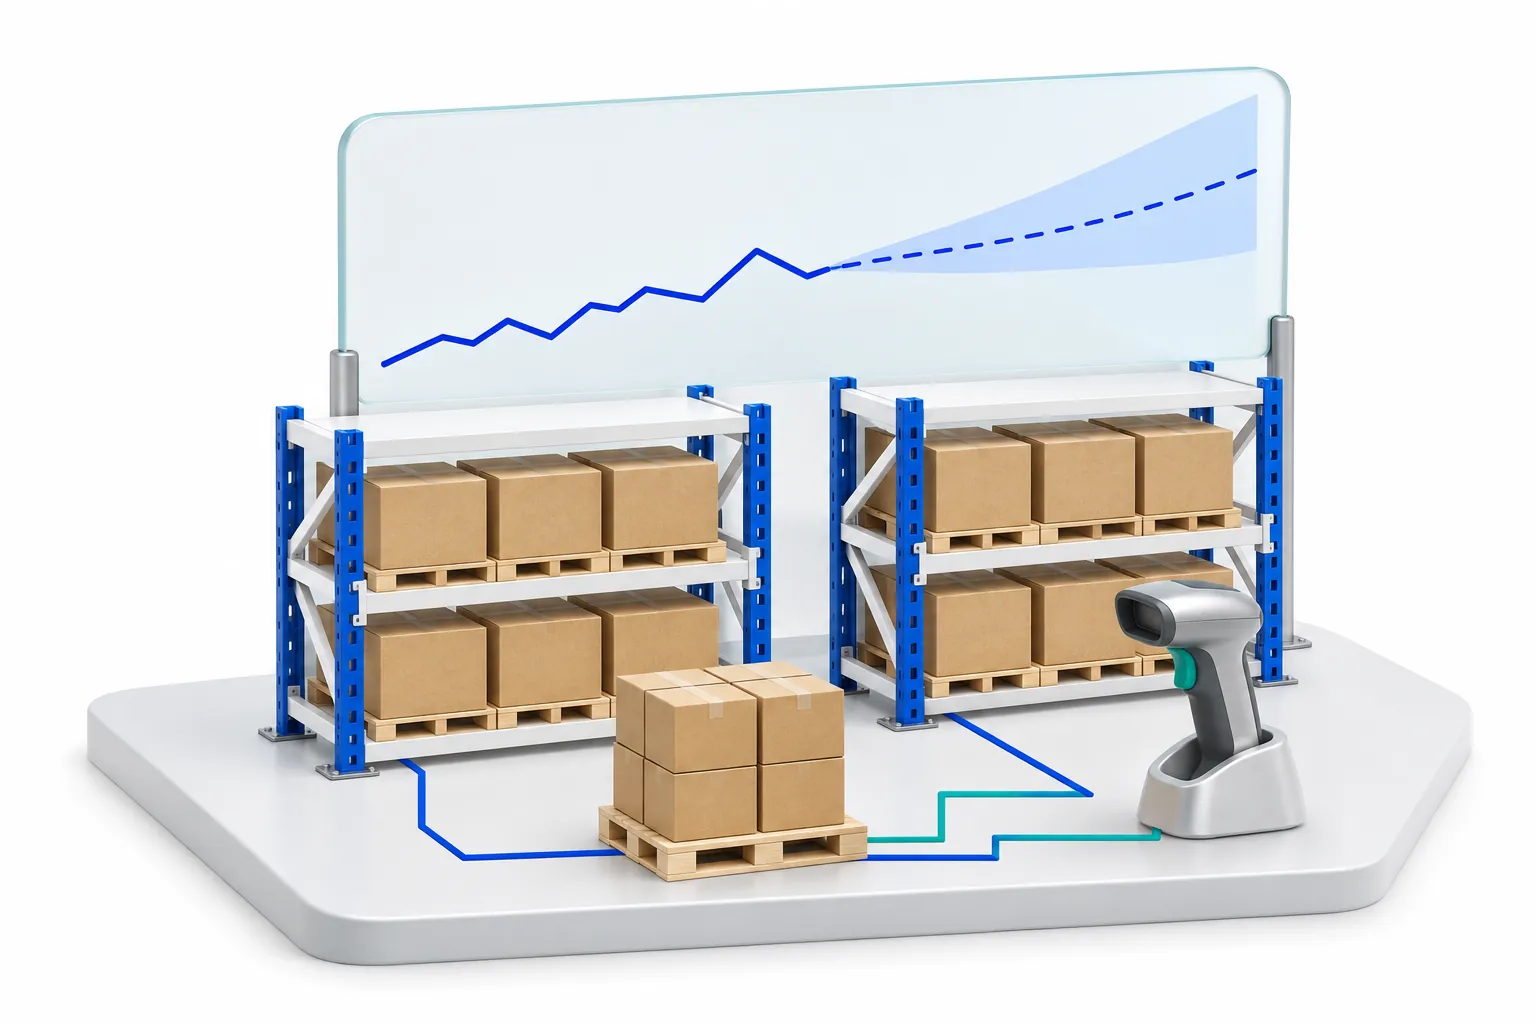
A packaging supplier plans production of corrugated boxes from a spreadsheet forecast that the planning team updates each month. Some sizes run out in peak weeks while others sit in the warehouse for months. An AI forecasting tool promises better numbers, and the demonstration looks convincing. Before buying, the useful questions are less about the algorithm and more about the basics: which history is reliable, how accuracy will be measured, what the forecast cannot know and who may change it. This guide works through those questions so a pilot produces evidence rather than another opinion.
A forecast without a range is a guess presented as a fact.
To apply this workflow in your business, explore our AI supply chAIn & inventory workflows service and implementation approach.
What is AI demand forecasting?
AI demand forecasting uses statistical and machine learning models to estimate future demand by item, location and period. The models learn from sales or shipment history and from drivers such as seasonality, price changes, promotions, calendar events and orders already on hand. Their main advantage over a spreadsheet is the ability to model thousands of items consistently and to take more of those drivers into account.
No model removes the limits of forecasting itself. In Forecasting: Principles and Practice, Hyndman and Athanasopoulos describe predictability as depending on how well we understand the factors that contribute to it, how much data is available, how similar the future is to the past and whether the forecasts can affect the thing being forecast. A new product launch or a single large project order strains several of those conditions at once, whatever the algorithm.
That is why any AI model should be compared with a simple method, such as repeating the same period last year, on the same history. If it cannot beat a simple baseline on your data, it is not ready to plan with.
References: Hyndman and Athanasopoulos, Forecasting: Principles and Practice (3rd ed.): what can be forecast
What data do you need for AI demand forecasting?
Most of the data sits in the ERP, but rarely in a form ready for modelling. The table lists what a pilot usually needs and the problems most worth fixing before the first model is trained.
Two corrections matter more than the rest. Flag the periods when an item was out of stock, because sales recorded during a stockout show what was available rather than what customers wanted. And separate one-off orders from regular demand, so a single large project does not teach the model a pattern that will not repeat.
| Data | Why it matters | Common problem to fix first |
|---|---|---|
| Sales orders or shipments by item, location and week | The history the model learns from | Shipments show what was available, not what customers wanted |
| Stockout and availability records | Separates weak demand from empty shelves | Days out of stock are not recorded, so lost sales look like low demand |
| Promotions and price changes | Explains spikes and dips | Dates live in emails or a marketing calendar, not the ERP |
| Product lifecycle and replacements | Links new items to the ones they replace | Replacement codes are not mapped, so history restarts at zero |
| Customer orders on hand and known projects | Shows demand already committed | Large one-off orders are mixed in with regular demand |
| Calendar and seasonal events | Captures holidays, month-end and seasonal patterns | Week definitions differ between systems |
How do you measure forecast accuracy?
A forecast error is the difference between actual demand and the forecast for a period. Accuracy measures summarise those errors in different ways, and each answers a different question. Forecasting: Principles and Practice explains that measures such as MAE are on the scale of the data, so they cannot compare items sold in different units or volumes, and that minimising MAE leads to forecasts of the median while minimising RMSE leads to forecasts of the mean.
Bias deserves a place beside every error measure. Errors that average close to zero suggest a balanced forecast; errors that are consistently positive or negative mean the forecast runs low or high. The same book makes the point about model residuals: if they have a mean other than zero, the forecasts are biased.
| Measure | How it is calculated | Use it for | Watch out for |
|---|---|---|---|
| MAE (mean absolute error) | Average of the absolute errors | One item, or items in the same unit | Cannot compare items with different volumes or units |
| MAPE (mean absolute percentage error) | Average of the absolute errors as a percentage of actual demand | Steady, high-volume items | Undefined when demand is zero and unstable when it is small |
| WAPE (weighted absolute percentage error) | Sum of absolute errors divided by the sum of actual demand | Product families with mixed volumes | Dominated by high-volume items, so check slow movers separately |
| MASE (mean absolute scaled error) | Errors scaled by the error of a simple naive forecast on the history | Checking that a model beats a simple method | Harder to explain to non-specialists |
| Bias (mean error) | Average of the signed errors | Spotting consistent over or under forecasting | Positive and negative errors cancel, so pair it with MAE or WAPE |
References: Forecasting: Principles and Practice (3rd ed.): evaluating point forecast accuracy; Forecasting: Principles and Practice (3rd ed.): residual diagnostics; Amazon Forecast documentation: evaluating predictor accuracy, including WAPE
Why can MAPE be misleading for demand forecasts?
MAPE expresses each error as a percentage of actual demand and averages the results. Hyndman and Athanasopoulos list its drawbacks: it is infinite or undefined when actual demand is zero, extreme when demand is close to zero, and it penalises forecasts that are too high more heavily than forecasts that are too low. Spare parts and long-tail ranges, where many periods have little or no demand, expose all three.
An illustrative example shows the effect. A slow-moving part sells 2 units against a forecast of 4, an error of 100%. A fast-moving part sells 1,000 units against a forecast of 1,100, an error of 10%. The MAPE across the two is 55%, driven almost entirely by two units. WAPE divides the total absolute error by total actual demand instead: 102 ÷ 1,002, or about 10.2%.
WAPE has its own blind spot: it is dominated by high-volume items, so a product family can look accurate while slow movers are poorly forecast. Report WAPE for the family and review slow movers separately, using unit errors or a scaled measure.
References: Forecasting: Principles and Practice (3rd ed.): evaluating point forecast accuracy
Why should demand forecasts be shown as ranges?
A single number hides how uncertain it is. Forecasting: Principles and Practice describes a prediction interval as a range within which the actual value is expected to lie with a specified probability, notes that point forecasts can be of almost no value without one, and explains that intervals usually widen as the forecast horizon lengthens.
Ranges connect directly to stock and capacity decisions. If next month's forecast is 1,000 boxes with an illustrative 80% range of 850 to 1,200, the planner can hold stock towards the upper part of the range for items where running out is costly, and nearer the middle where surplus stock is the bigger cost. Amazon's forecasting documentation makes a related point: where being understocked costs more than being overstocked, a forecast at a higher quantile can be more informative than the median.
Check that the ranges are honest. Over time, roughly 80% of actual results should fall inside an 80% range. If far fewer do, the ranges are too narrow and stock decisions based on them will be too optimistic.
References: Forecasting: Principles and Practice (3rd ed.): prediction intervals; Amazon Forecast documentation: choosing forecast types and quantiles
How should planners review and override AI forecasts?
Planners and sales teams know things a model cannot, such as a customer's new contract, a planned promotion or a competitor's supply problem. Forecasting: Principles and Practice finds that judgmental adjustments help most when there is significant additional information or strong evidence of a need, and that small adjustments, especially upward ones, tend to reduce accuracy.
Make overrides deliberate. Keep the model's forecast and the adjusted forecast side by side, record who changed it and why, and compare the accuracy of both over time so you can see whether adjustments add value. The same book recommends documenting and justifying every adjustment, which also discourages changes made for comfort rather than evidence.
Keep the forecast separate from the sales target. A forecast describes what is likely; a target describes what the business wants. When the two are merged, forecasts drift towards optimism and stock decisions follow.
References: Forecasting: Principles and Practice (3rd ed.): judgmental adjustments
How do you start an AI demand forecasting pilot?
Choose one product family with a clear owner, reasonable history and a mix of fast and slow movers. Backtest first: generate forecasts for past periods using only the data available at the time, then compare them with actual demand and with the current method using the same measures.
Agree the success criteria before the pilot starts, for example lower WAPE than the current method, bias close to zero and ranges that contain the expected share of actual results. Run the new forecast alongside the existing process for a few planning cycles, and decide how ranges and overrides will feed replenishment before scaling to more families.
Questions readers ask
How much history does AI demand forecasting need?
Enough to cover several full seasonal cycles where seasonality matters, with stockouts, promotions and product changes recorded. New items with no history are usually forecast from similar items they replace or resemble, with wider ranges and closer human review.
Is AI forecasting always more accurate than statistical methods?
No. Simple and statistical methods are strong baselines, especially for stable items with limited data. Test any AI model against them on the same historical periods and with the same accuracy measures before relying on it.
What is a good forecast accuracy target?
There is no universal figure. Achievable accuracy depends on volume, variability, lead time and how far ahead you forecast. Set targets from your own baseline, track bias alongside error, and compare any new method with the current one on the same items.
Should demand planners use MAPE or WAPE?
For a mix of fast and slow movers, WAPE is usually more stable because it divides total error by total demand, so periods with near-zero demand do not dominate. MAPE can work for steady, high-volume items. Whichever you choose, report bias as well.
A practical starting checklist
- One product family with stockouts flagged
- Agreed accuracy measures, including bias
- Forecasts shown as ranges, not single numbers
- Every override recorded with a reason
AI demand forecasting is worth doing when the data is clean, the measures are fair and the uncertainty is visible. Start with one product family, compare it with today's method and let the evidence decide how far to scale.
Original guide by the IOT Software and Solutions editorial team. External facts are linked to their sources; examples are illustrative and do not describe measured client results.